
Overview of Real time application monitoring:
Real-time monitoring is the process of collecting and storing performance metrics for data as it traverses your network. It involves polling and streaming data from infrastructure devices so that you know how your networks, applications, and services are performing. It’s the process of continuously gathering data that you can use to quickly jump into action when problems arise. But there wasn’t always a need for this.
A number of commands are available that when issued return real-time information about queues and channels. Information can be returned for one or more queues or channels and can vary in quantity. Real-time monitoring can be used in the following tasks:
· Helping system administrators understand the steady state of their system. This helps with problem diagnosis if a problem occurs in the system.
· Determining the condition of your queue manager at any moment, even if no specific event or problem has been detected.
· Assisting with determining the cause of a problem in your system.
Performance Testing:
Performance testing is a form of software testing that focuses on how a system running the system performs under a particular load. This is not about finding software bugs or defects. Different performance testing types measures according to benchmarks and standards. Performance testing gives developers the diagnostic information they need to eliminate bottlenecks.
Overview of JMeter:
The Apache JMeter is pure Java open source software, which was designed to load test functional behavior and measure performance. You can use JMeter to analyze and measure the performance of web application or a variety of services. JMeter originally is used for testing Web Application or FTP application. Nowadays, it is used for a functional test, database server test etc.
Advantages of JMeter -Performance testing tool :

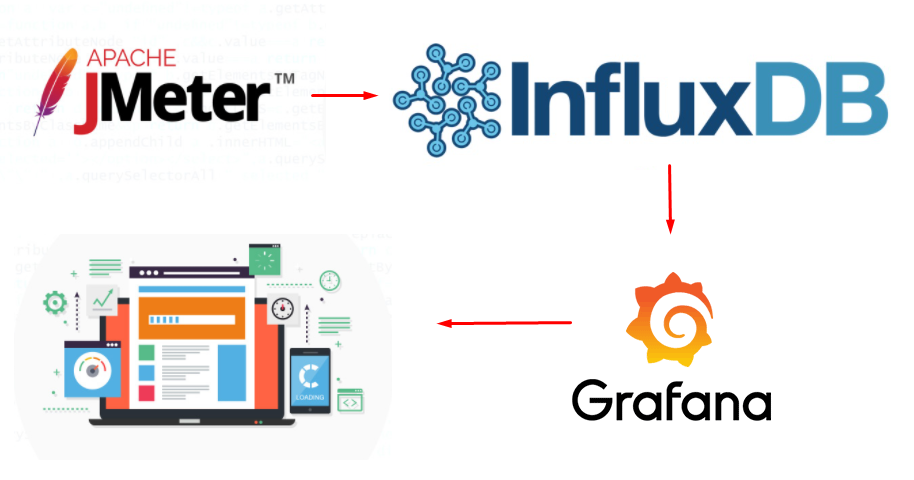
Why are we integrating JMeter with InfluxDB and Grafana?
The JMeter GUI is great for creating and debugging test plans, however, it is always recommended to run the tests in Non-GUI mode. As running tests in GUI mode can consume a lot of resources and potentially produce unreliable load test results. But running tests in Non-GUI mode means you have to wait until the test is complete too see the results. While this might be okay for short tests but for longer running soak tests you might want to examine the results while the test is running.
To achieve this real time monitoring, we are integrating JMeter with InfluxDB and Grafana.
What is InfluxDB?
InfluxDB is an open source Time Series Database (TSDB). It is specialized in operations like monitoring, application metrics and real-time analytics. Also it is meant to be used as a backing store for any use case involving large amounts of timestamped data.
What is Grafana?
Grafana is an open source visualization and analytics software. It is a solution for running data analytics, pulling up metrics and monitor our apps with the help of dashboards. Grafana allows you to query, alert on, visualize and explore your metrics no matter wherever they are stored. It also helps us track the user behavior , application behavior, frequency of errors present in production or pre-prod environment etc.
It provides you with tools to turn your time-series database (TSDB) data into graphs and visualizations. With the help of the tools we study, analyze and monitor data over a particular period of time technically known as time series analytics.
Advantages of InfluxDB , Grafana Integrated with JMeter :
· Live real-time results
· Visualized key metrics help understand what is occurring during the test
· Store test results for longer duration
· Ability to compare 2 or more performance tests
· Customize performance dashboards in any way you want
- Getting Started with Real Time Monitoring :
1.1 Installing JMeter

Prerequisites:
. JAVA (preferably 8 or later version) must be installed on the computer/build agent/container which will perform all these operations.
. Download Apache JMeter 5.5 using the below link and extract it into the same machine. Please use the latest version.
Link : https://dlcdn.apache.org//jmeter/binaries/apache-jmeter-5.5.tgz
. Once the installation is complete, launch Apache JMeter and read the license terms. Click Agree if you accept the terms, and JMeter will finish installing, then JMeter will automatically start.
1.2 Installing InfluxDB

Download InfluxDB 1.7.3 using the below link and extract it into the same machine.
Link:- https://dl.influxdata.com/influxdb/releases/influxdb-1.7.3_windows_amd64.zip
Configuring InfluxDB file :
In Extracted folder, Open Notepad “influxdb” and follow the below steps

Step 1: Search for “graphite” , remove the ‘#’ highlighted and change “enabled = true” under [[graphite]]

Step 2: Edited Notepad should look like below for [[graphite]] section

1.3 Installing Grafana
Download Grafana using the below link and extract it into the same machine.
Link: https://dl.grafana.com/enterprise/release/grafana-enterprise-8.5.1.windows-amd64.msi

1.4 Creating test scripts in JMeter
After Installation process completed , user need to create test script that will generate the load on the server.Thus Performance testing will be conducted.
Follow the below steps to create Test scripts:
Step 1: Start JMeter

Step 2: Create a Test Plan with Thread Group (Users)
Right click on “Test Plan” → Add → Threads (Users) → Thread Group


Samplers- All the Test requests we add in JMeter are called as Samplers
Number of Threads — This is the count of virtual users that we are expecting to connect to the server.
Ramp-Up Period — This can be defined as the time in which JMeter can bring the number of threads mentioned above into the running state. This is given in seconds.
Loop Count — This indicates how many times each thread was supposed to perform the task. If the number of threads is 4 and the loop count is 2 then the same task will be performed 8 times.
Specify Thread lifetime — Here we can give the duration and startup delay to the threads.

Step 3: Add a Sampler (Http)
Right click “Thread Group” → Add → Sampler → HTTP Request


Protocol [http] — Protocol of the test website. eg:http/ https
Server Name or IP — Server name of test website without any other path
HTTP request — Select Http request from dropdown that need to test .
eg: GET/POST/PUT/DELETE
For PUT/POST requests — “Body data” field should get populated

Step 4: Add Listeners
Listeners — They shows the results of the test execution. They can show results in a different format such as a tree, table, graph or log file
For eg: To view the result as Tree ,
Right click Test Plan, Add -> Listener -> View Result Tree
Save the Test script in the format of .jmx

1.5 Creating database in InfluxDB
Step 1: InfluxDB server should get started before creating database.
To start InfluxDB server, open “Influxd” from folder and minimize. Server is started now.


Step 2: Once server is started, open Influx client to interact with server.


Step 3: Enter “create user root with password ‘root’” to create user and enter “Show users” to view the created user

Step 4: To Create a database , Enter “Create database <database_name>” and to view the created database, enter “Show databases”

Step 5: Enter “Use <database_name>” to use the created database

1.6 Configuring InfluxDB in JMeter
We have to configure InfluxDB database to Jmeter using Backend Listener.
Step 1: Right click “Thread Group” , Add → Listener → Backend listener

Step 2: Select Backend Listener implementation as “org.apache.jmeter.visualizers.backend.influxdb.BackendListenerClient” from the dropdown

Step 3: Update the parameters of backend listener as below mentioned
a) influxdbURL → It should be the URL where InfluxDB is hosted followed by database name. (Eg., http://localhost:8086/write?db=Jmeter_Demo )

b) application → Mention any name to identify multiple applications test results.

Now JMeter is successfully configured to send data stats to InfluxDB.
1.7 Configuring InfluxDB in Grafana
Open Grafana server from extracted folder and minimise.
Grafana 8.5.1 → bin → grafana-server

- To access Grafana, use http://localhost:3000/ (Grafana by default use 3000 port).

2. Login Grafana using admin/admin as username and password.

3. It will ask for password change, You can use the same admin as password or skip
4. Next step is to add InfluxDB data source in Grafana, For that go to
Settings icon → Data sources

5. click on add data source.

6. Search for InfluxDB and select the source “InfluxDB”

7. Enter all the details as per below screenshot and click save.
URL: Paste InfluxDB url (eg: http://localhost:8086)

. Database: Name of the database created in InfluxDB
. User: created username in InfluxDB
. Password: Password of user created in InfluxDB
. HTTP: GET/POST/PUT

On Click “Save & Test” , message should be displayed as “Data source is working”

1.8 Importing Json/txt file to Grafana
Click ‘+’ , Create →Click “ Import“

Upload the attached json file “ Grafana_Dashboard” in “Upload Json file”

2. Executing Test script in JMeter
Run the test script in JMeter,

Results can be viewed in JMeter listeners,

3. Grafana generating real time results in Dashboard
To view the result in Grafana Dashboard, Navigate to ‘Home’

User can successfully view the result in Grafana Dashboard,

We can explore each section in detail on clicking explore option from the title of section

References :
1) JMeter, InfluxDB and Grafana Integration — ⋮IWConnect
2) JMeter Real-Time Monitoring, Integration With Grafana+InfluxDB 2.0 (Flux) — DZone Integration
No comments:
Post a Comment